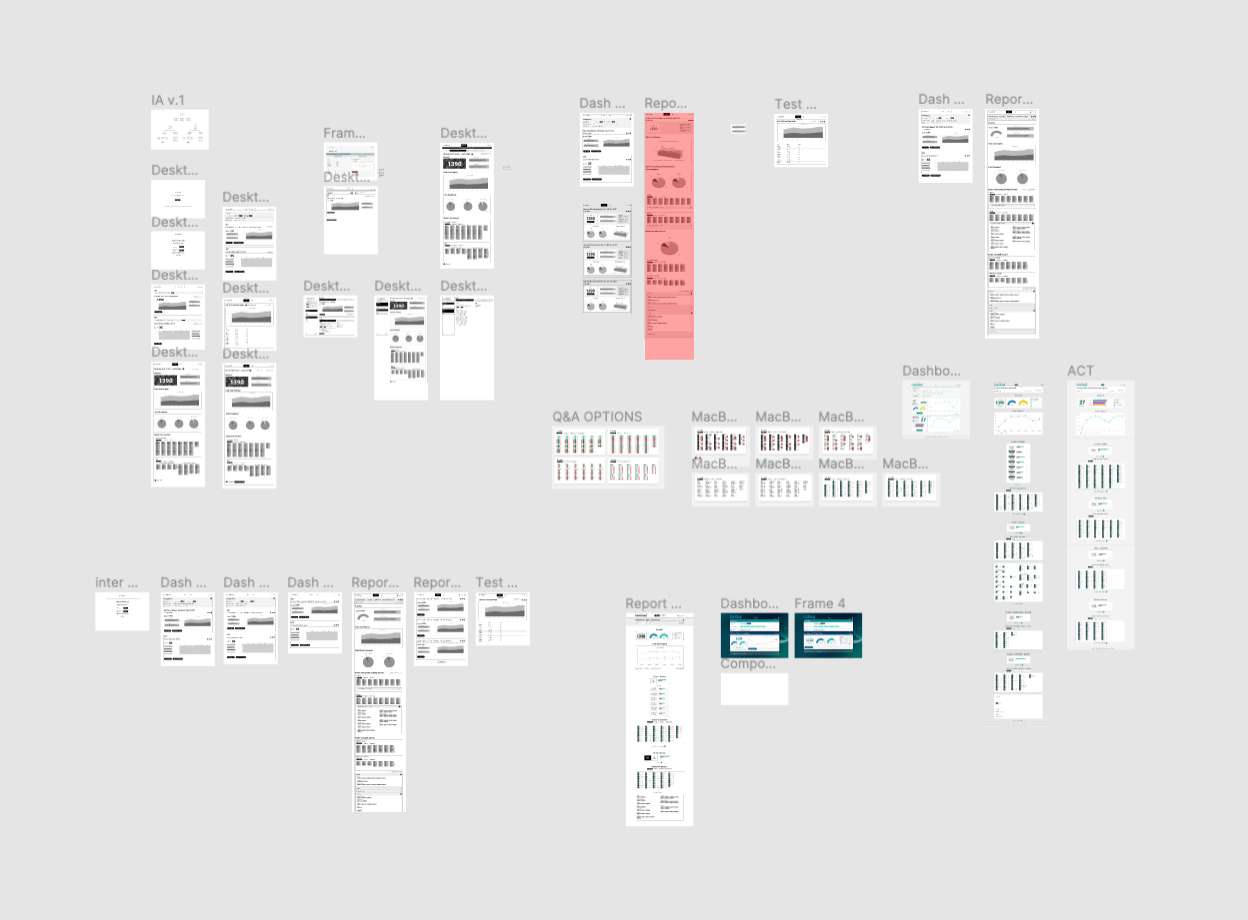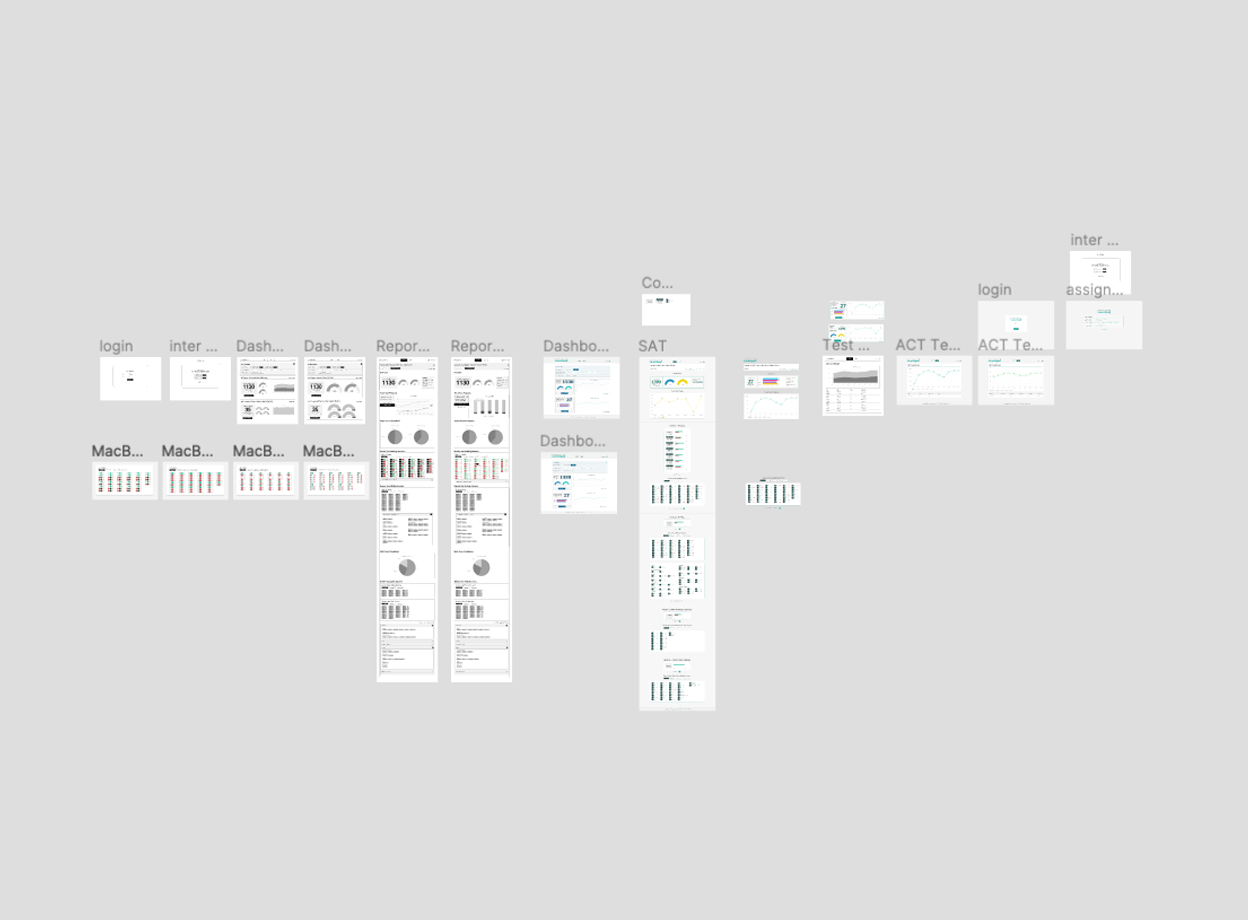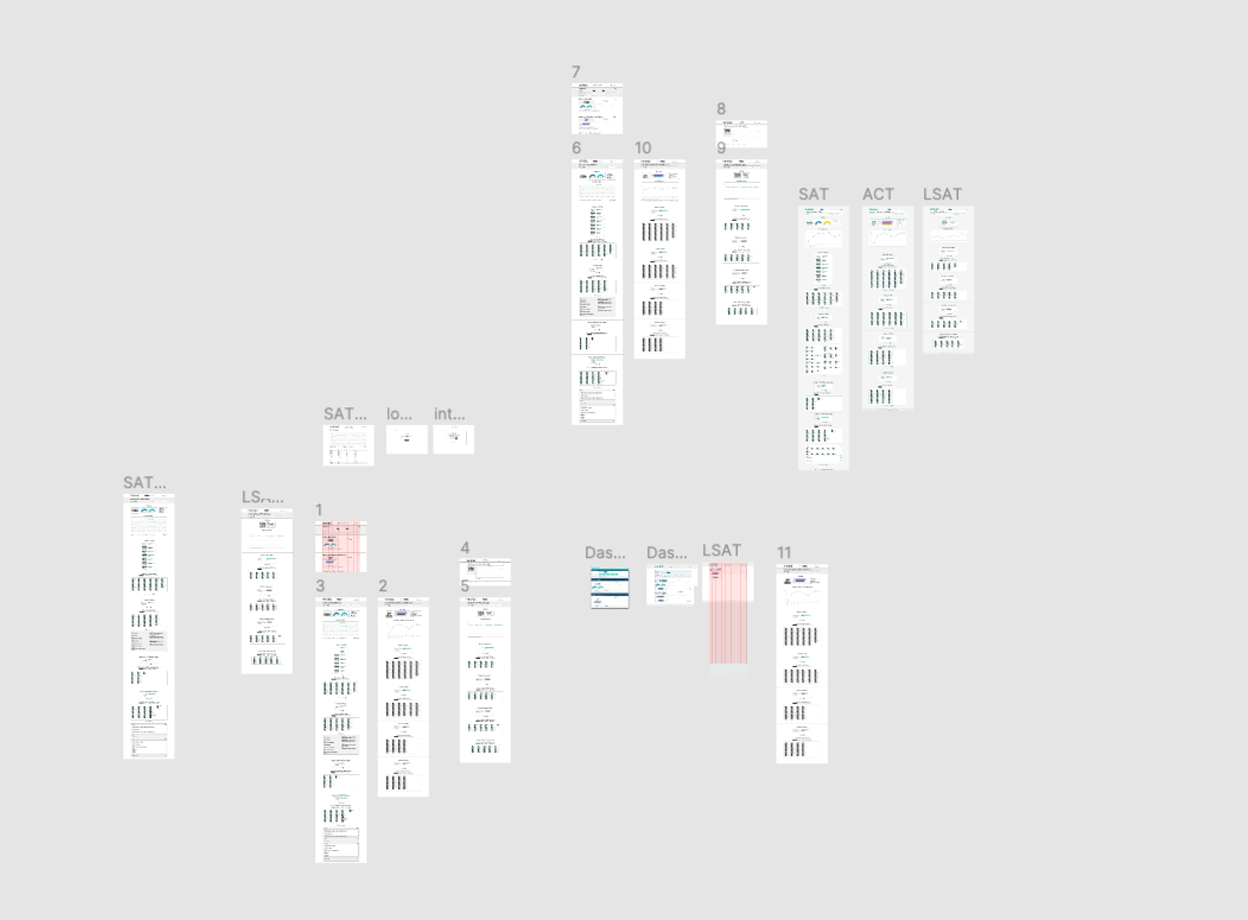
A long time client and leader in the College Test Prep field approached me to create a new app to facilitate the current video/in-person paradigm that has disrupted their long standing in-person based business model. Beginning with a Word document containing only asp.net data outputs displayed through MS Word form fields, I worked with their Technology Director to guide and execute every stage of the product life cycle, from the branding, personas, user stories, tutor/student interviews, wireframes, dozens of UI pattern iterations, and finally the visual design and front-end HTML/CSS/Bootstrap4 development.
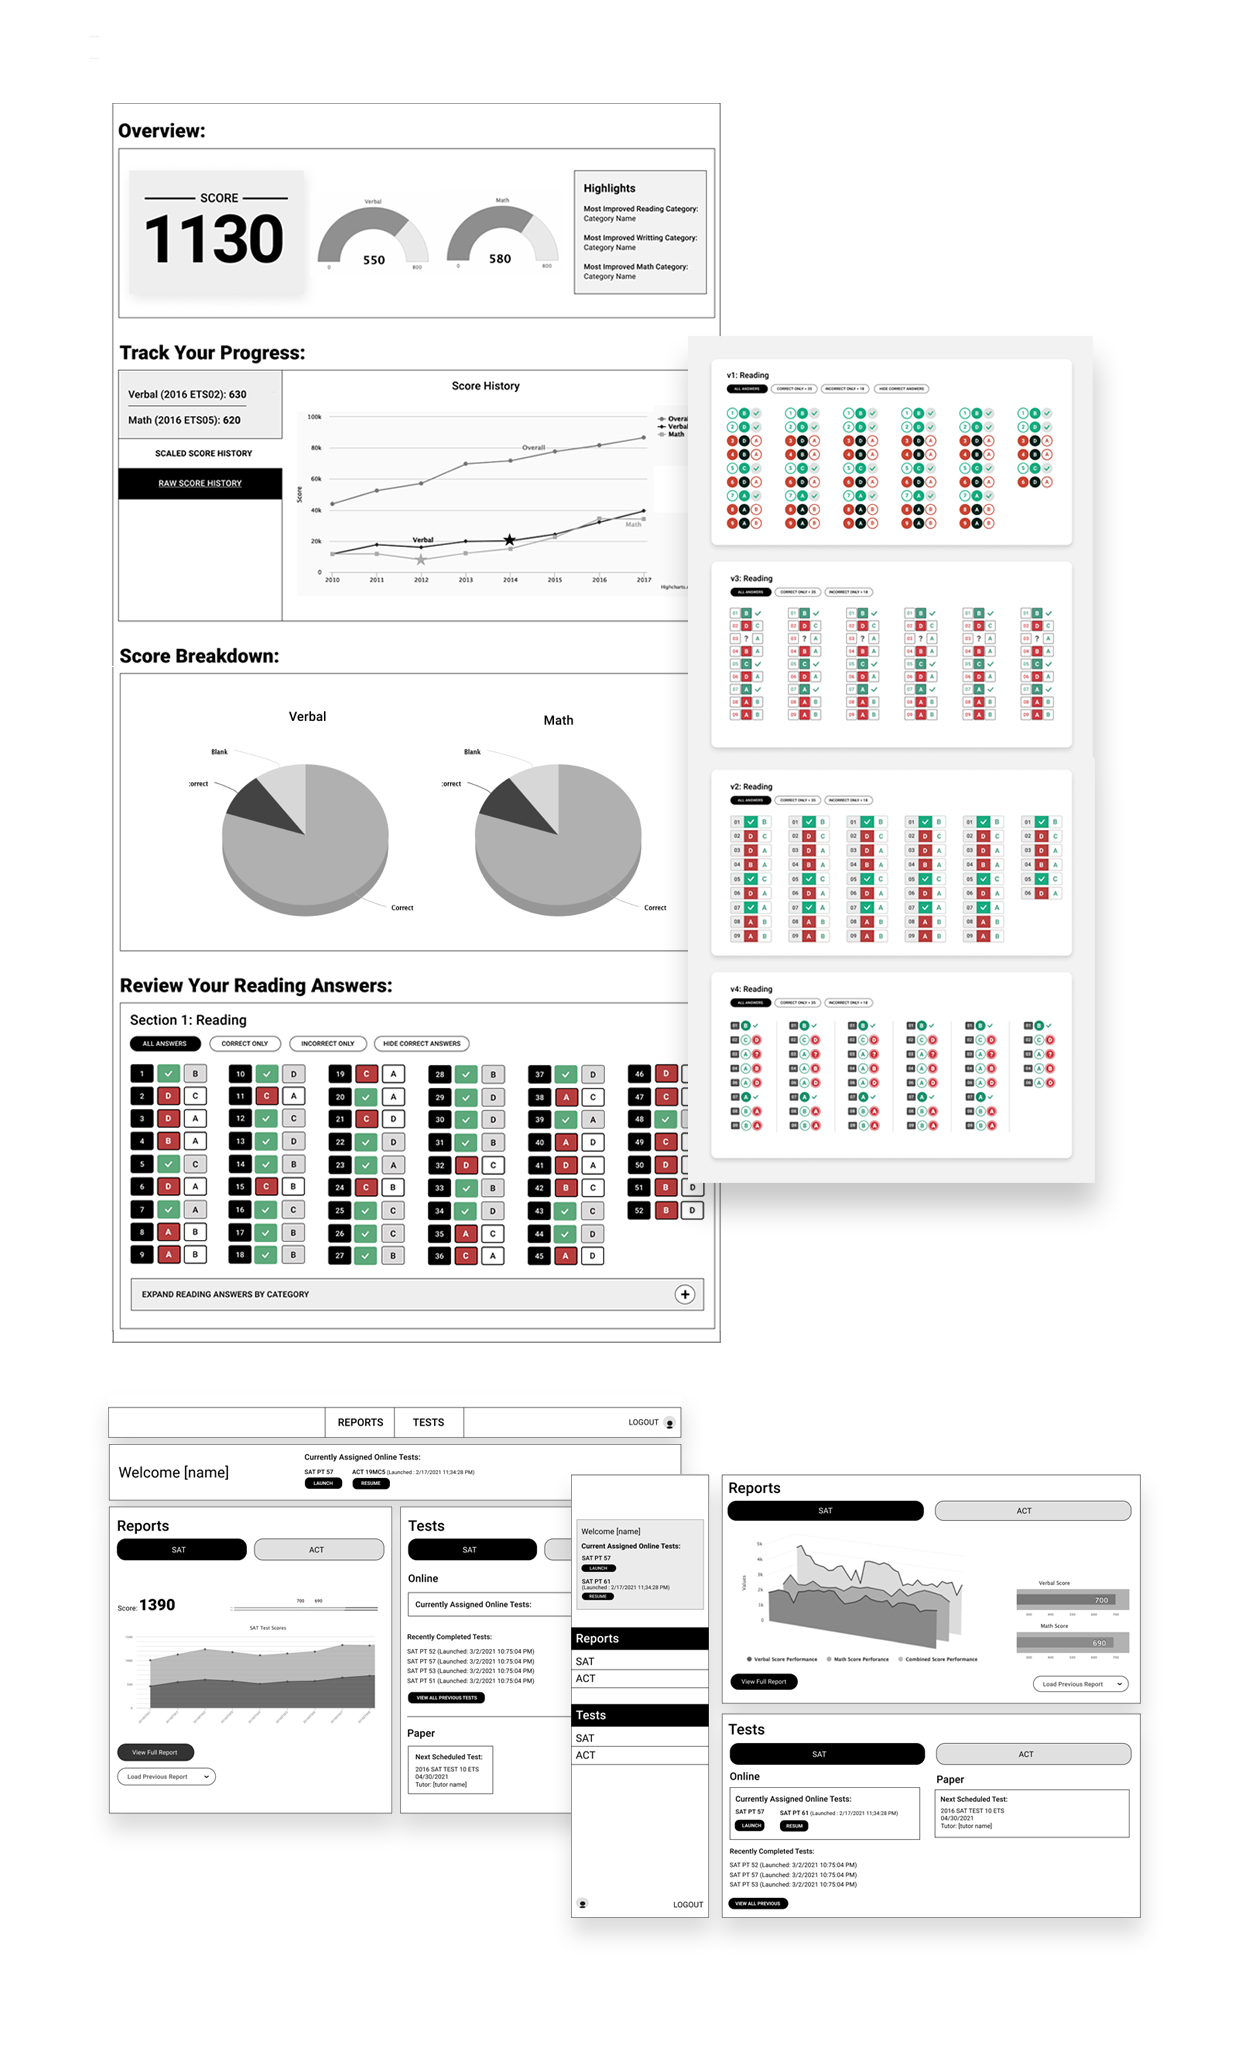
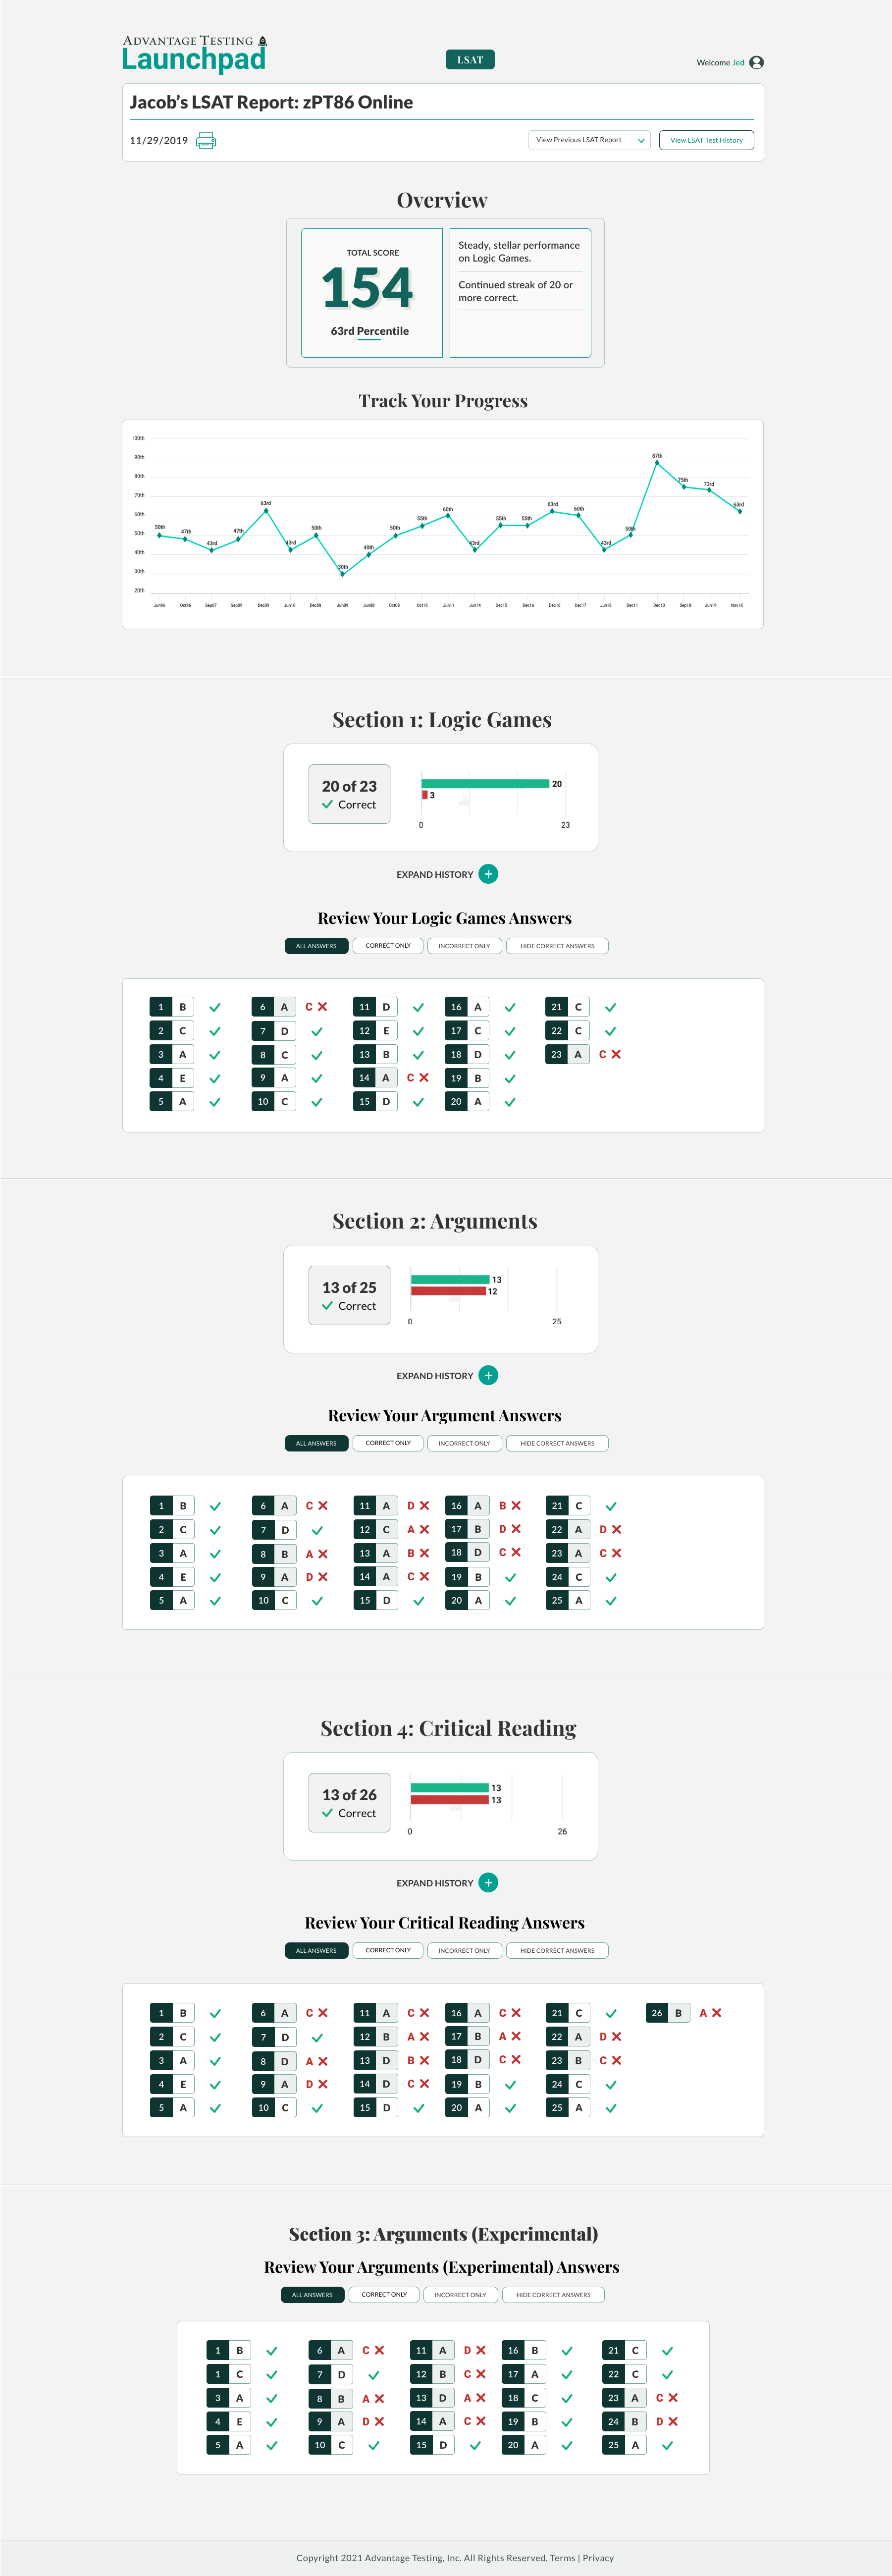
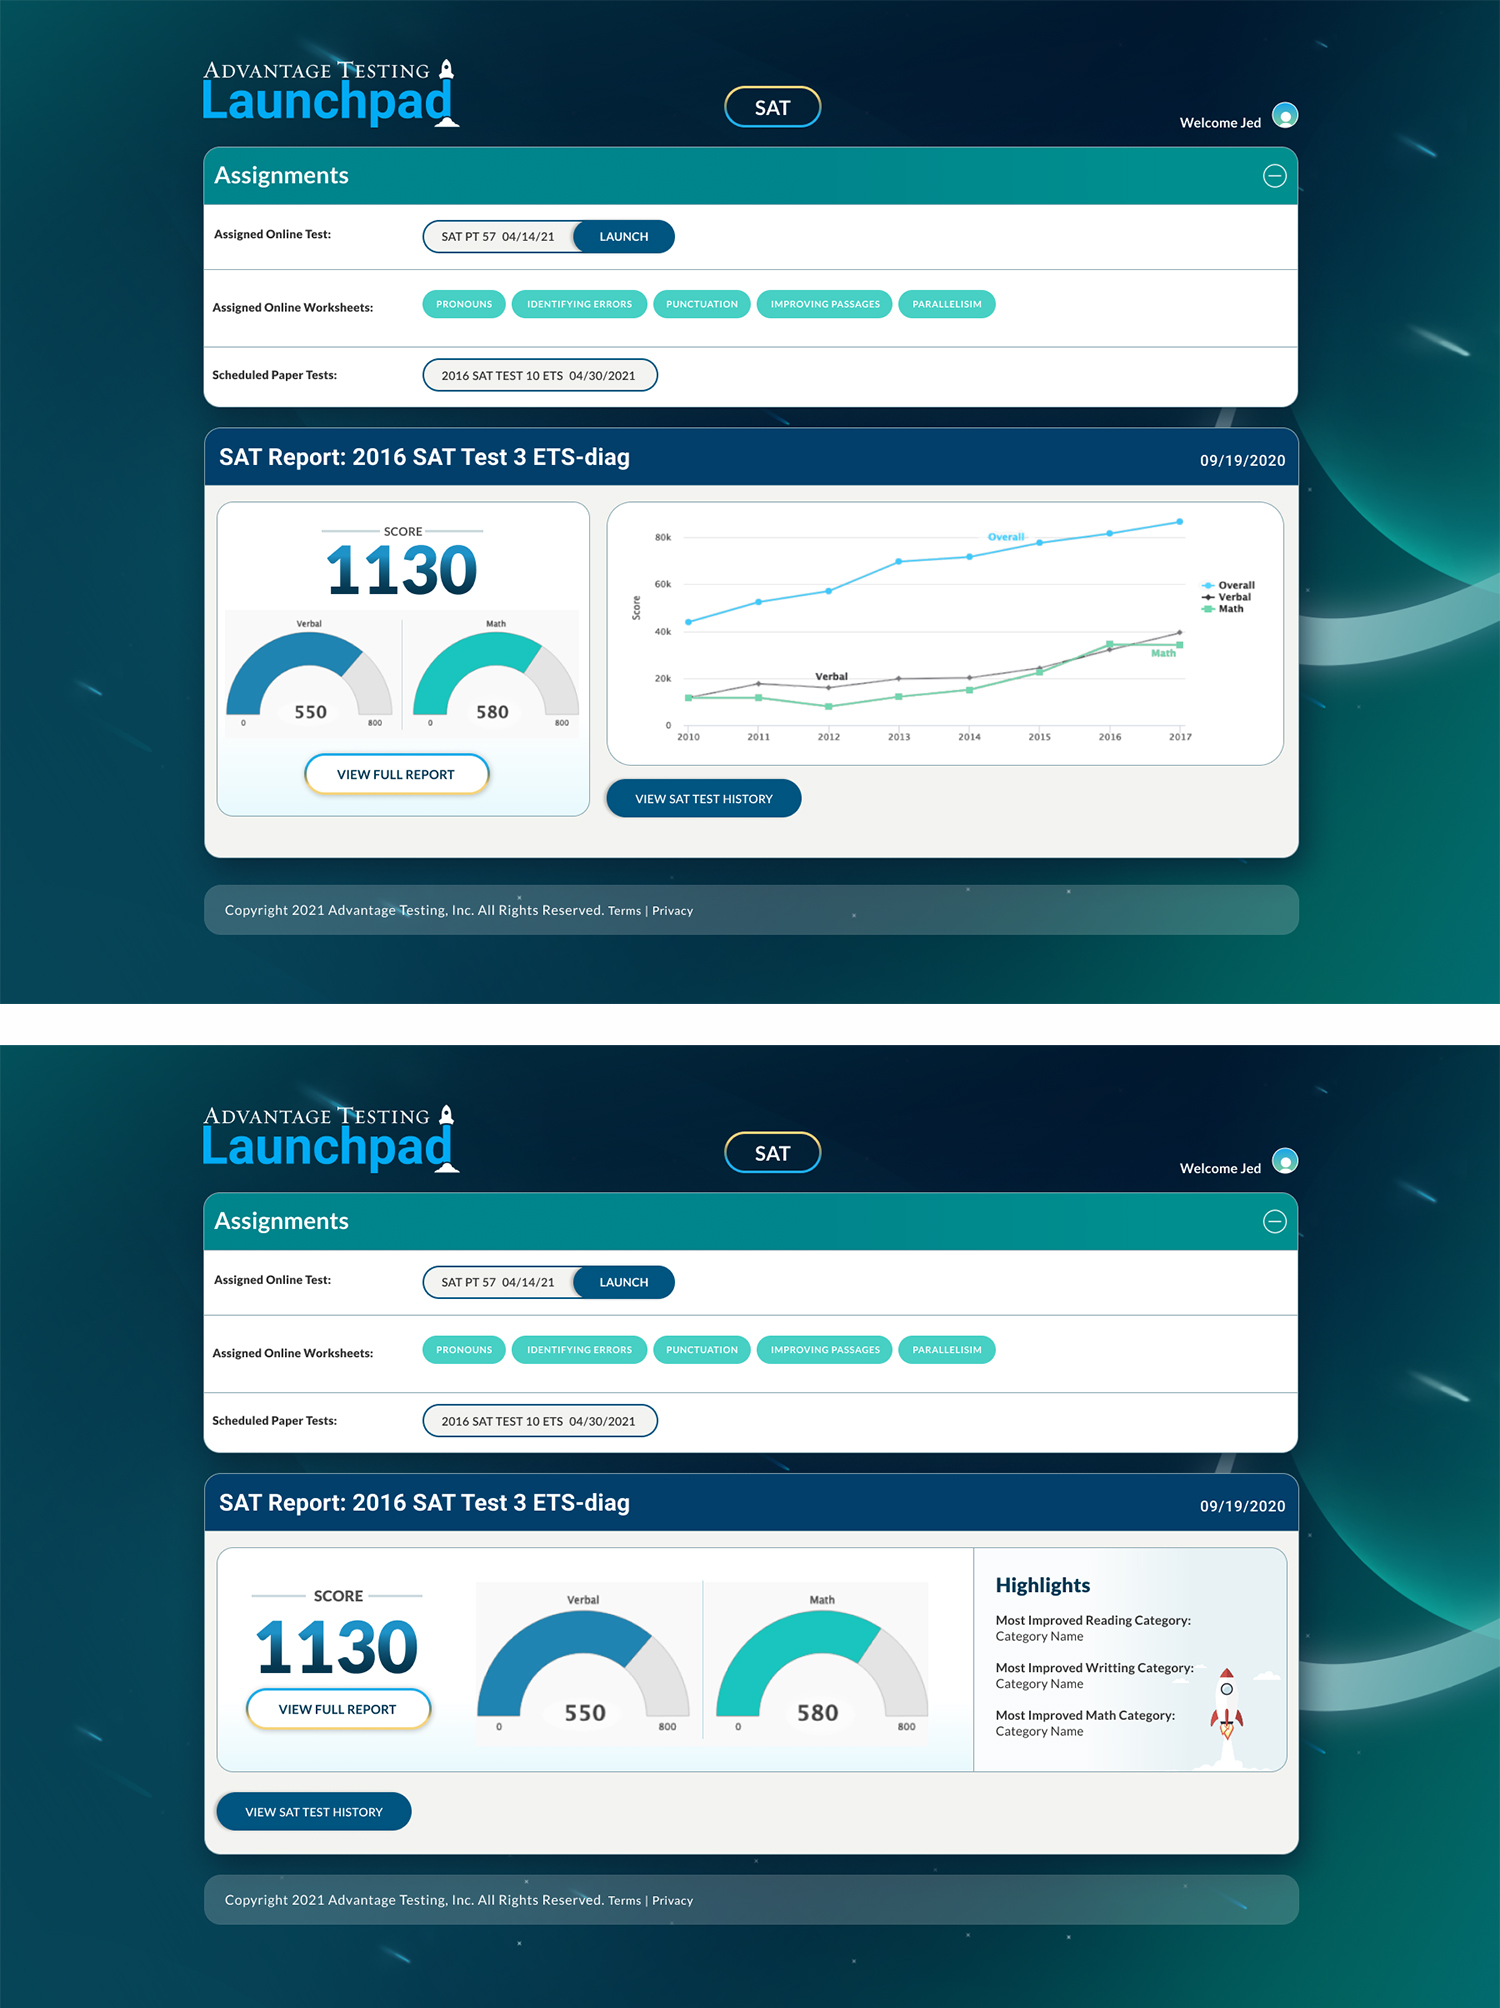
The main goal of the app is to provide test reports to parents in the most effective and visually appealing way possible, while also serving as a platform for tutors to work with students to be able to quickly identify areas that need improvement and tailor their instruction accordingly based on the metrics in the report.
CHALLENGE
Beginning with a document of data outputs in MS Word, I constructed a narrative of the two primary users of the app, the tutors and students. Identifying the incremental and unanticipated needs beyond the original primary mandate became clear through rounds of user stories and tutor/student interviews. What was once an only in-person model was immediately becoming a hybrid model with no precedence for best practice, thus anticipating the unforeseen obstacles and needs of the users was critical.
Another challenge was workflow. Their in-house team was based on asp.net core environment and developed in Visual Studio using 3rd party data visualization components such as Telerik and High Charts. My world is primarily Mac/Figma, so I downloaded Visual Studio and asp.net core onto my system and began building with the 3rd party MS component library Telerik, editing .js files to style the skin and labels of the various data visualizations I selected for the individual report metrics.
SOLUTION
Through many iterations of muiltiple layers of UI, from a single right/wrong answer cell to historical data visualizations covering a year of reports, the Technology Director and myself were able to communicate a story through the micro and macro data sets. One that took something complex, and made it pleasantly comprehensible, satisfying business needs, parents, and most importantly the tutors and students who now have a more effective learning tool.
I created all the screens in Figma, the branding and logo in Adobe, customized the data visualizations in a .js module, and provided a complete set of HTML/CSS files based on Bootstrap 4, from start to finish in 5 months and on budget.