
The illustration above was my portfolio submission to Neo4j - drawn by hand in Procreate.
The Situation
Neo4j's web presence had grown organically for years across multiple departments that rarely talked to each other. By the time I joined as Sr. UX/Visual Designer, the design system reflected that history in the worst possible way. A single page could have dependencies on three separate component libraries owned by three separate teams. Five versions of a card component meant fifteen code cases just to maintain one UI element. Nested libraries buried in subfolders, never published to the primary. No master page templates. A Figma environment that had been handed off, abandoned, and reinherited enough times that nothing was reliable.
The site ran on legacy WordPress with Gutenberg and the Classic Editor, which meant React components required injection hacks just to function. One component, three codebases. That was the baseline.
What I Did
I rebuilt the design system from the ground up in Figma using states and variables - one card component with five variable states instead of five separate cards. Master page templates. A cleaned and ADA-compliant color palette. Individual components for stories, testimonials, and repeating content patterns. Published, maintained, and documented so junior designers could actually use it without breaking things.
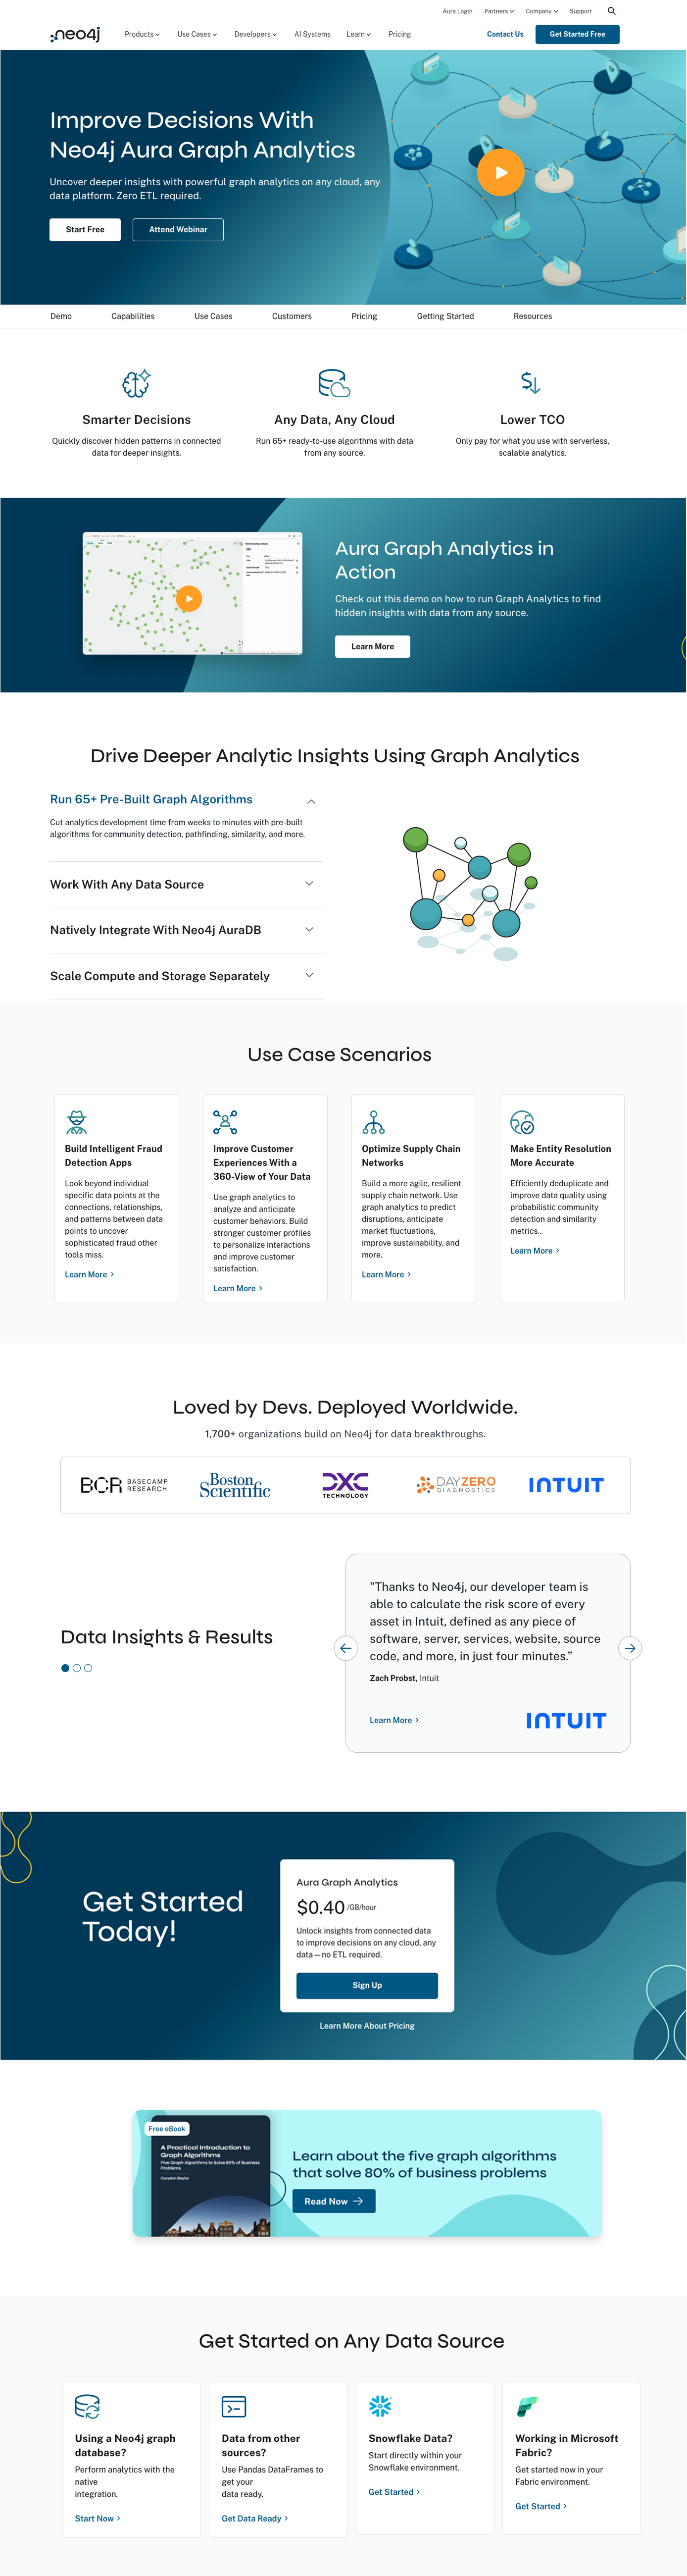
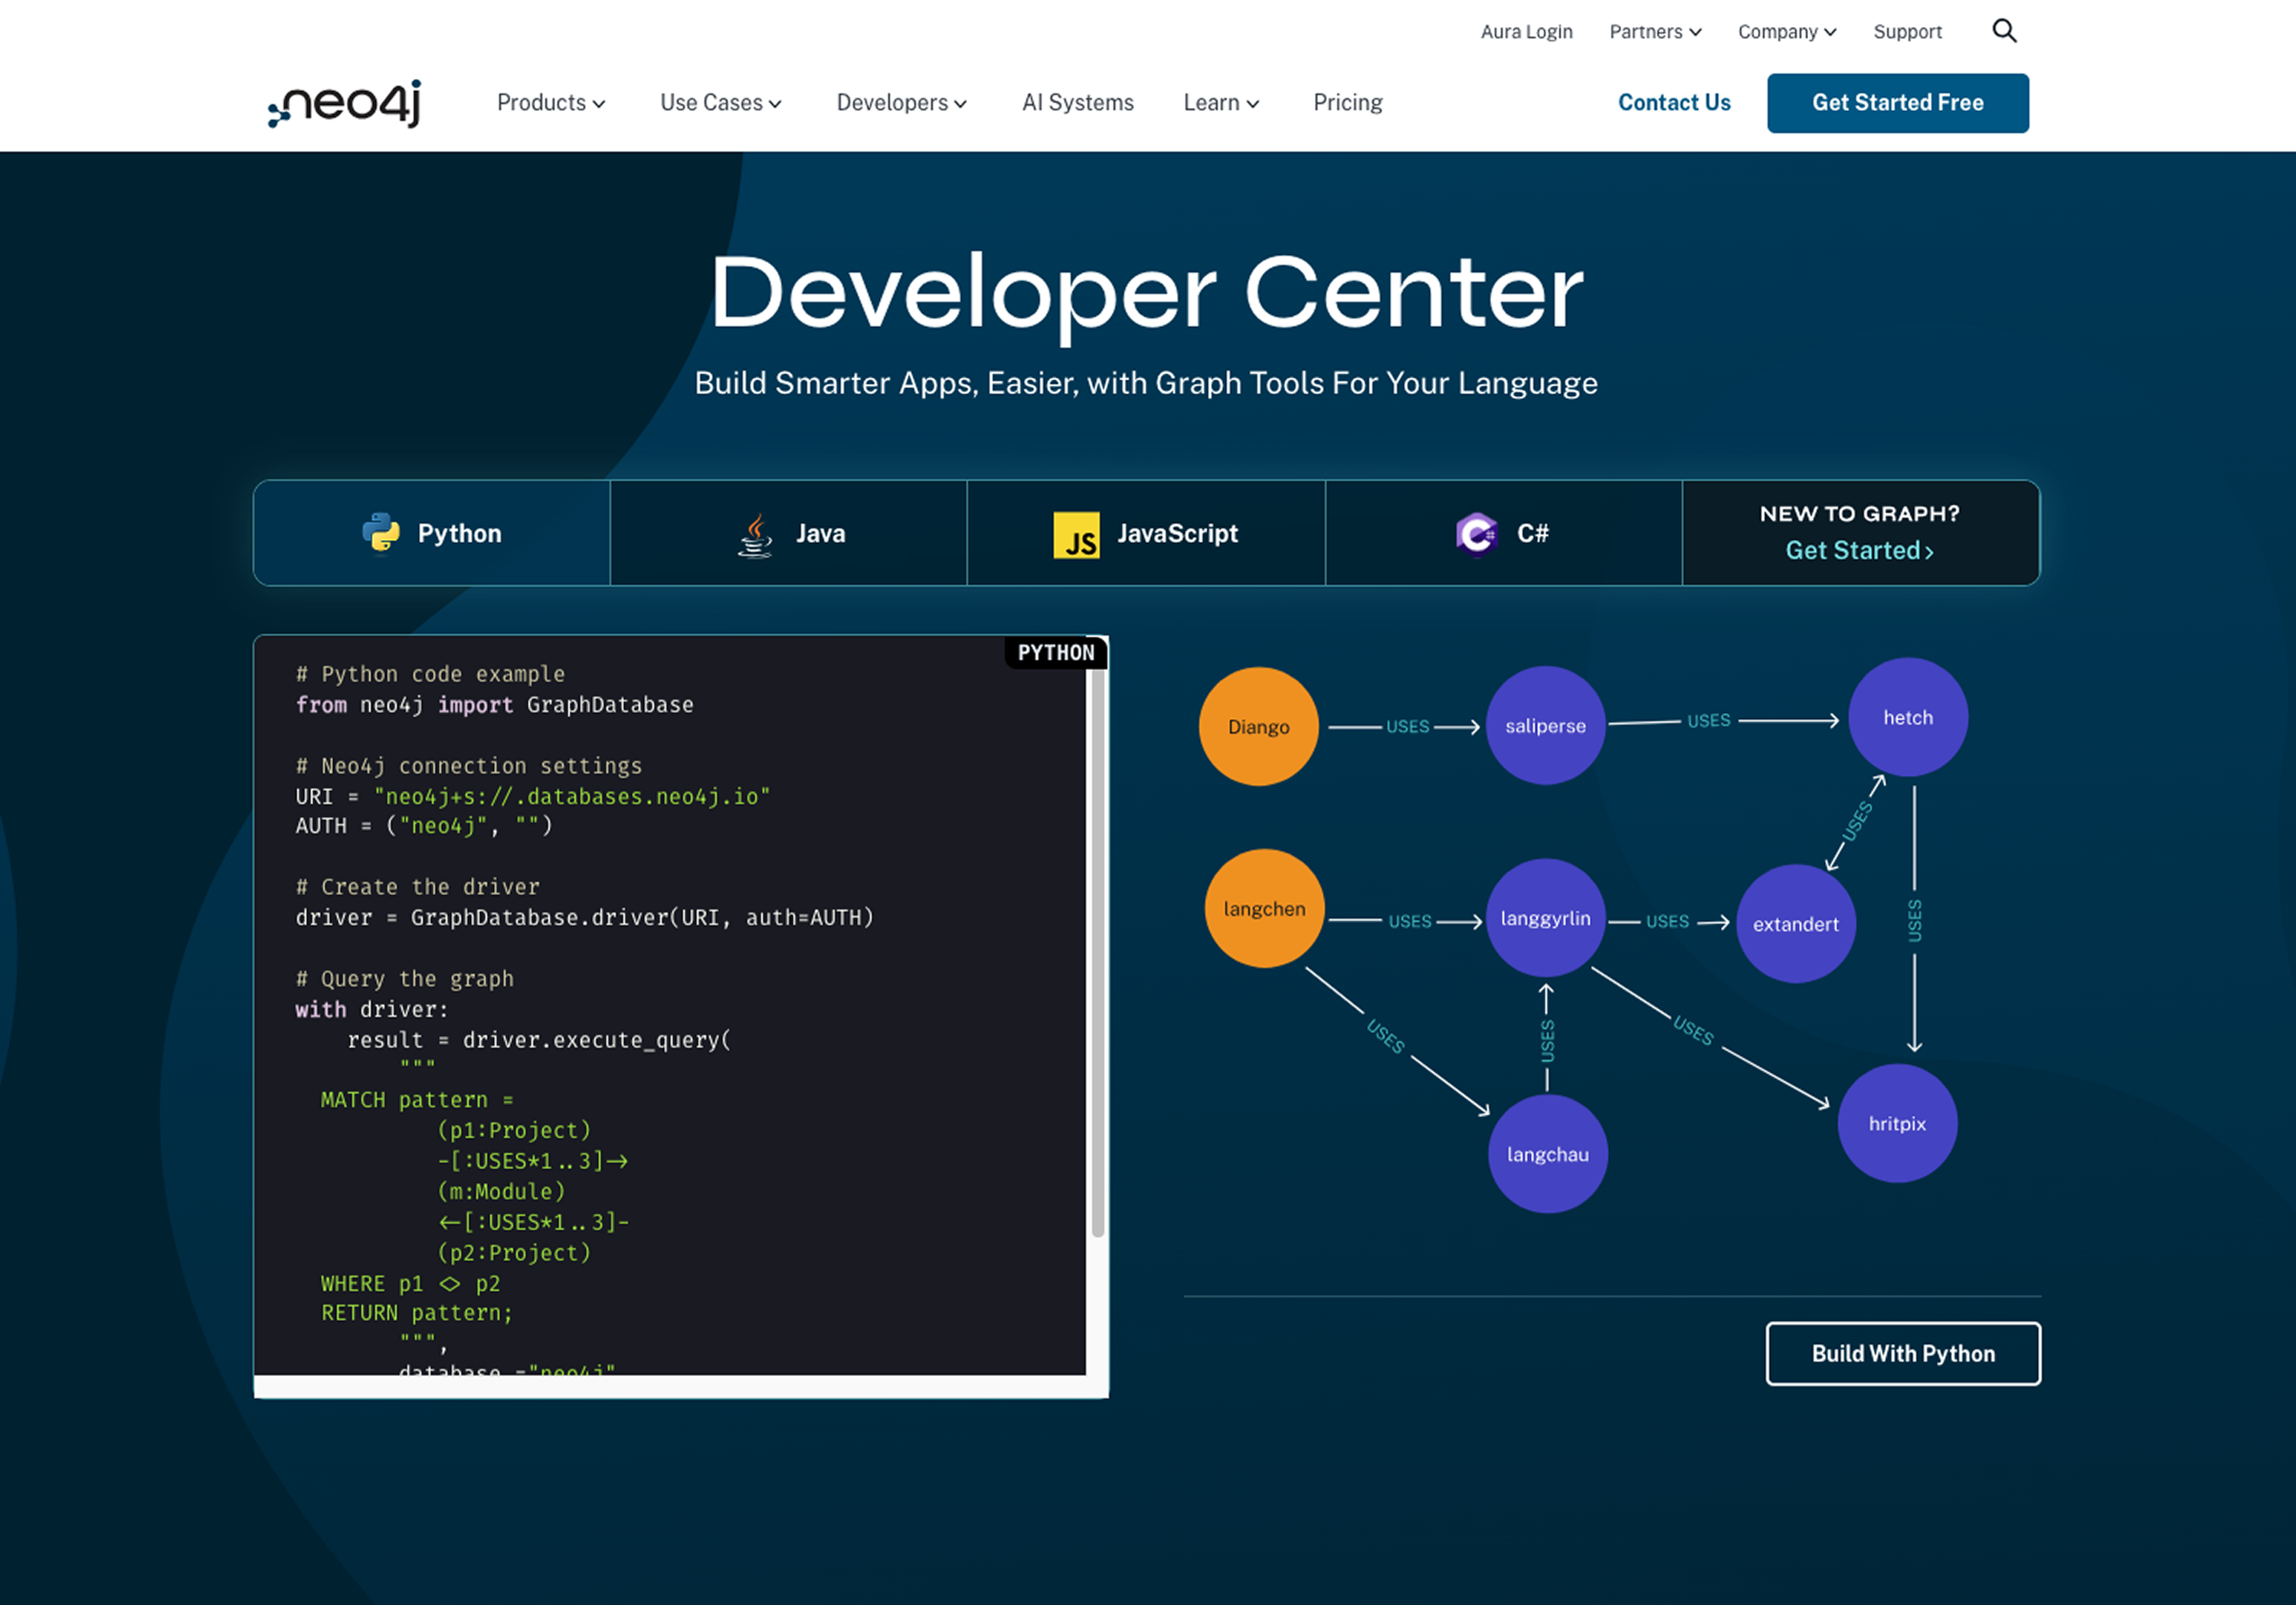
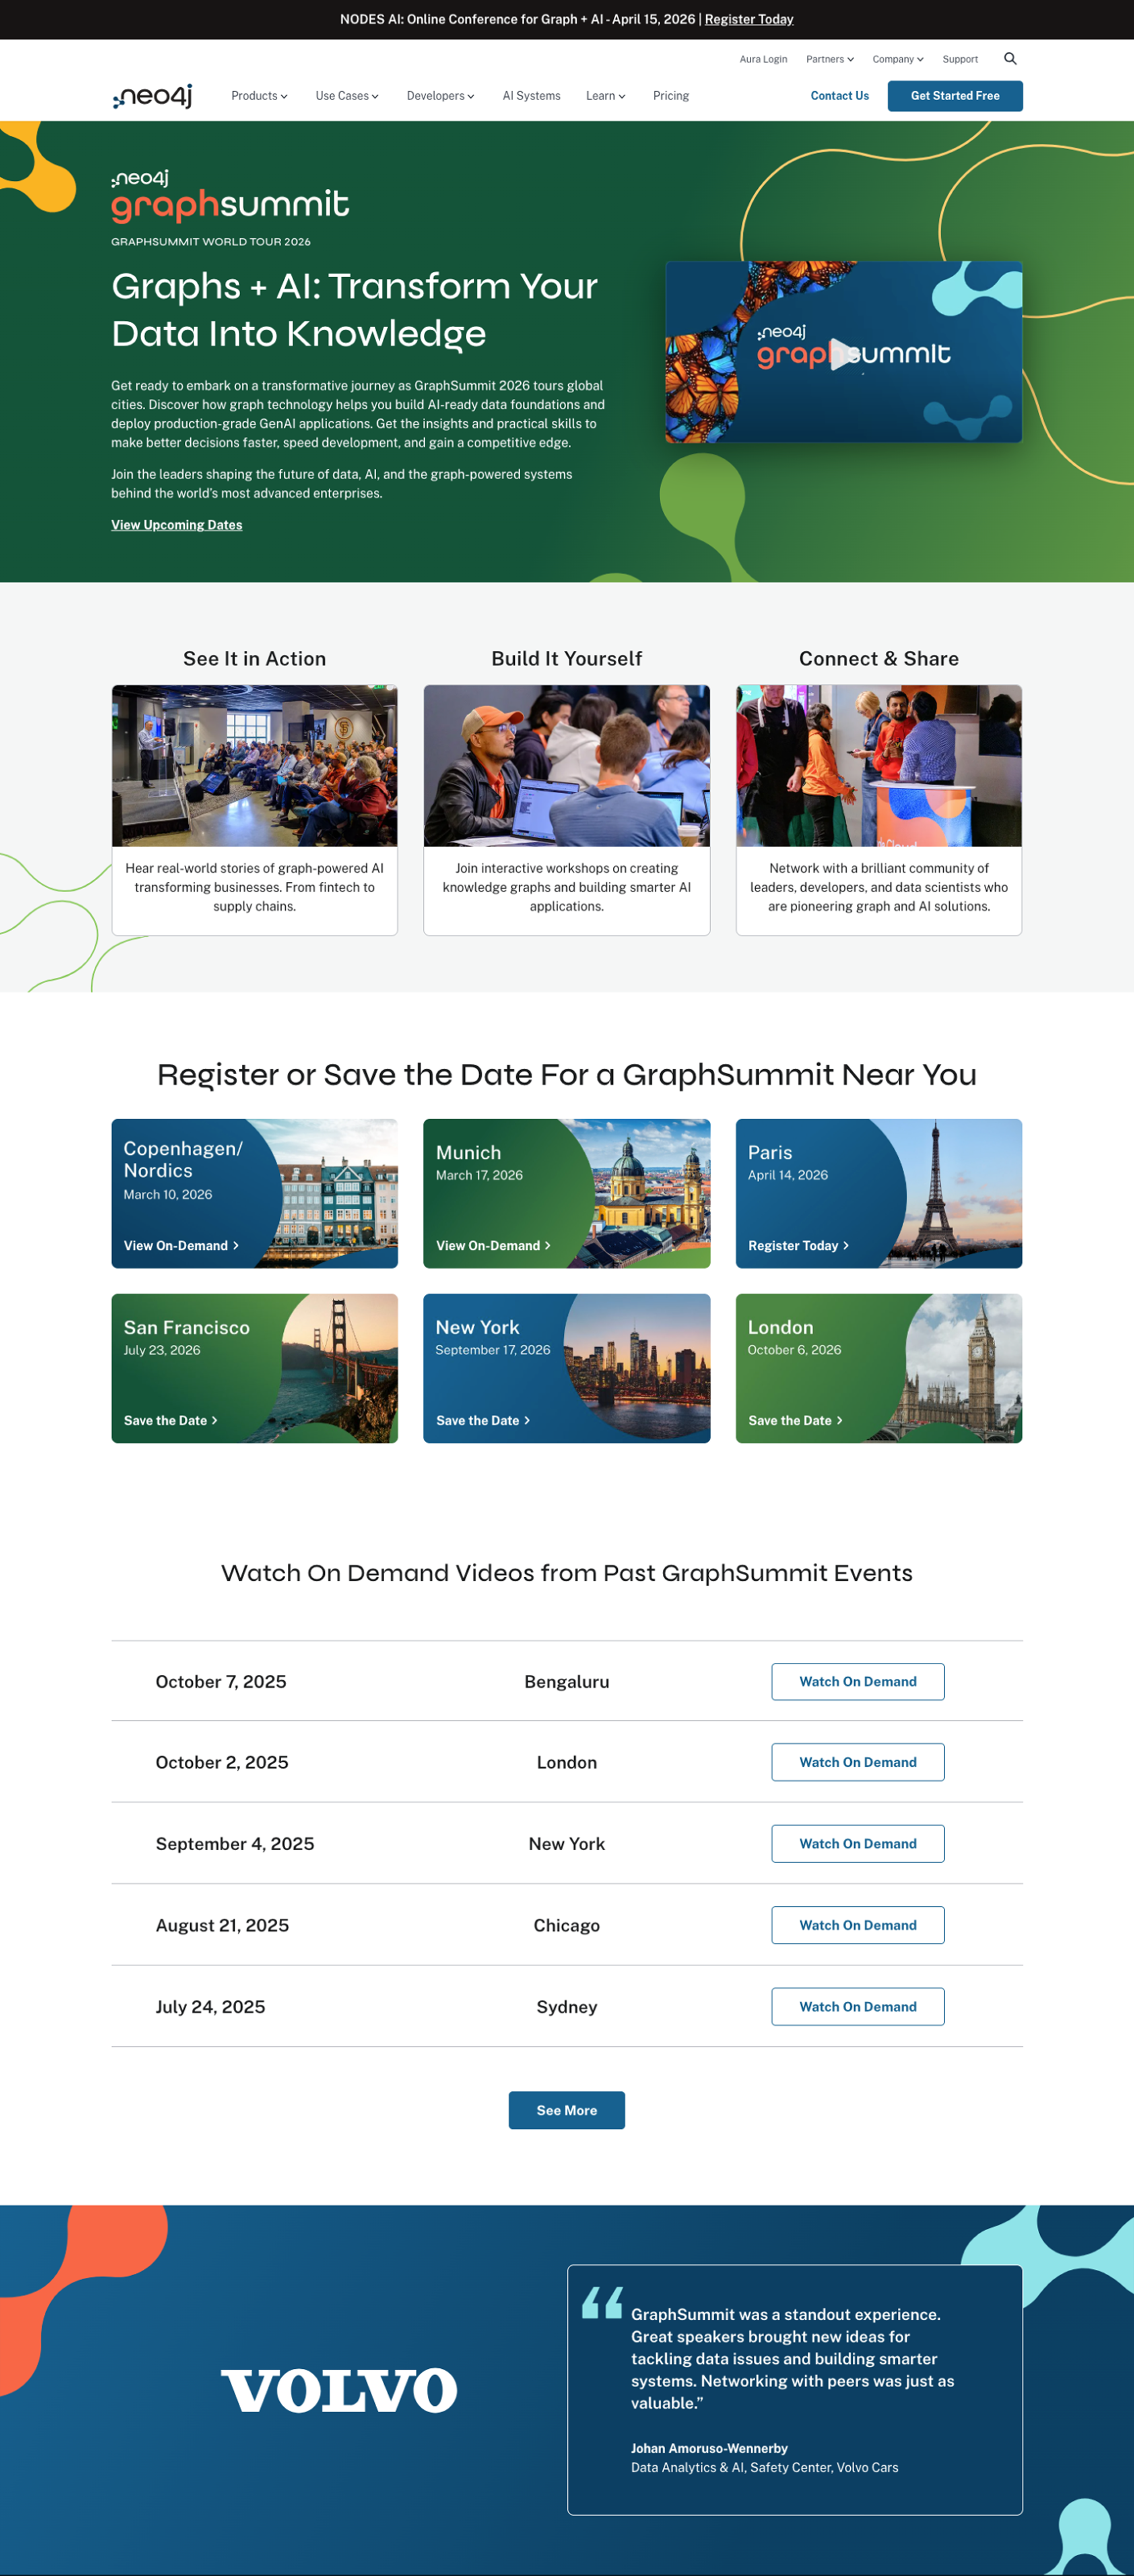
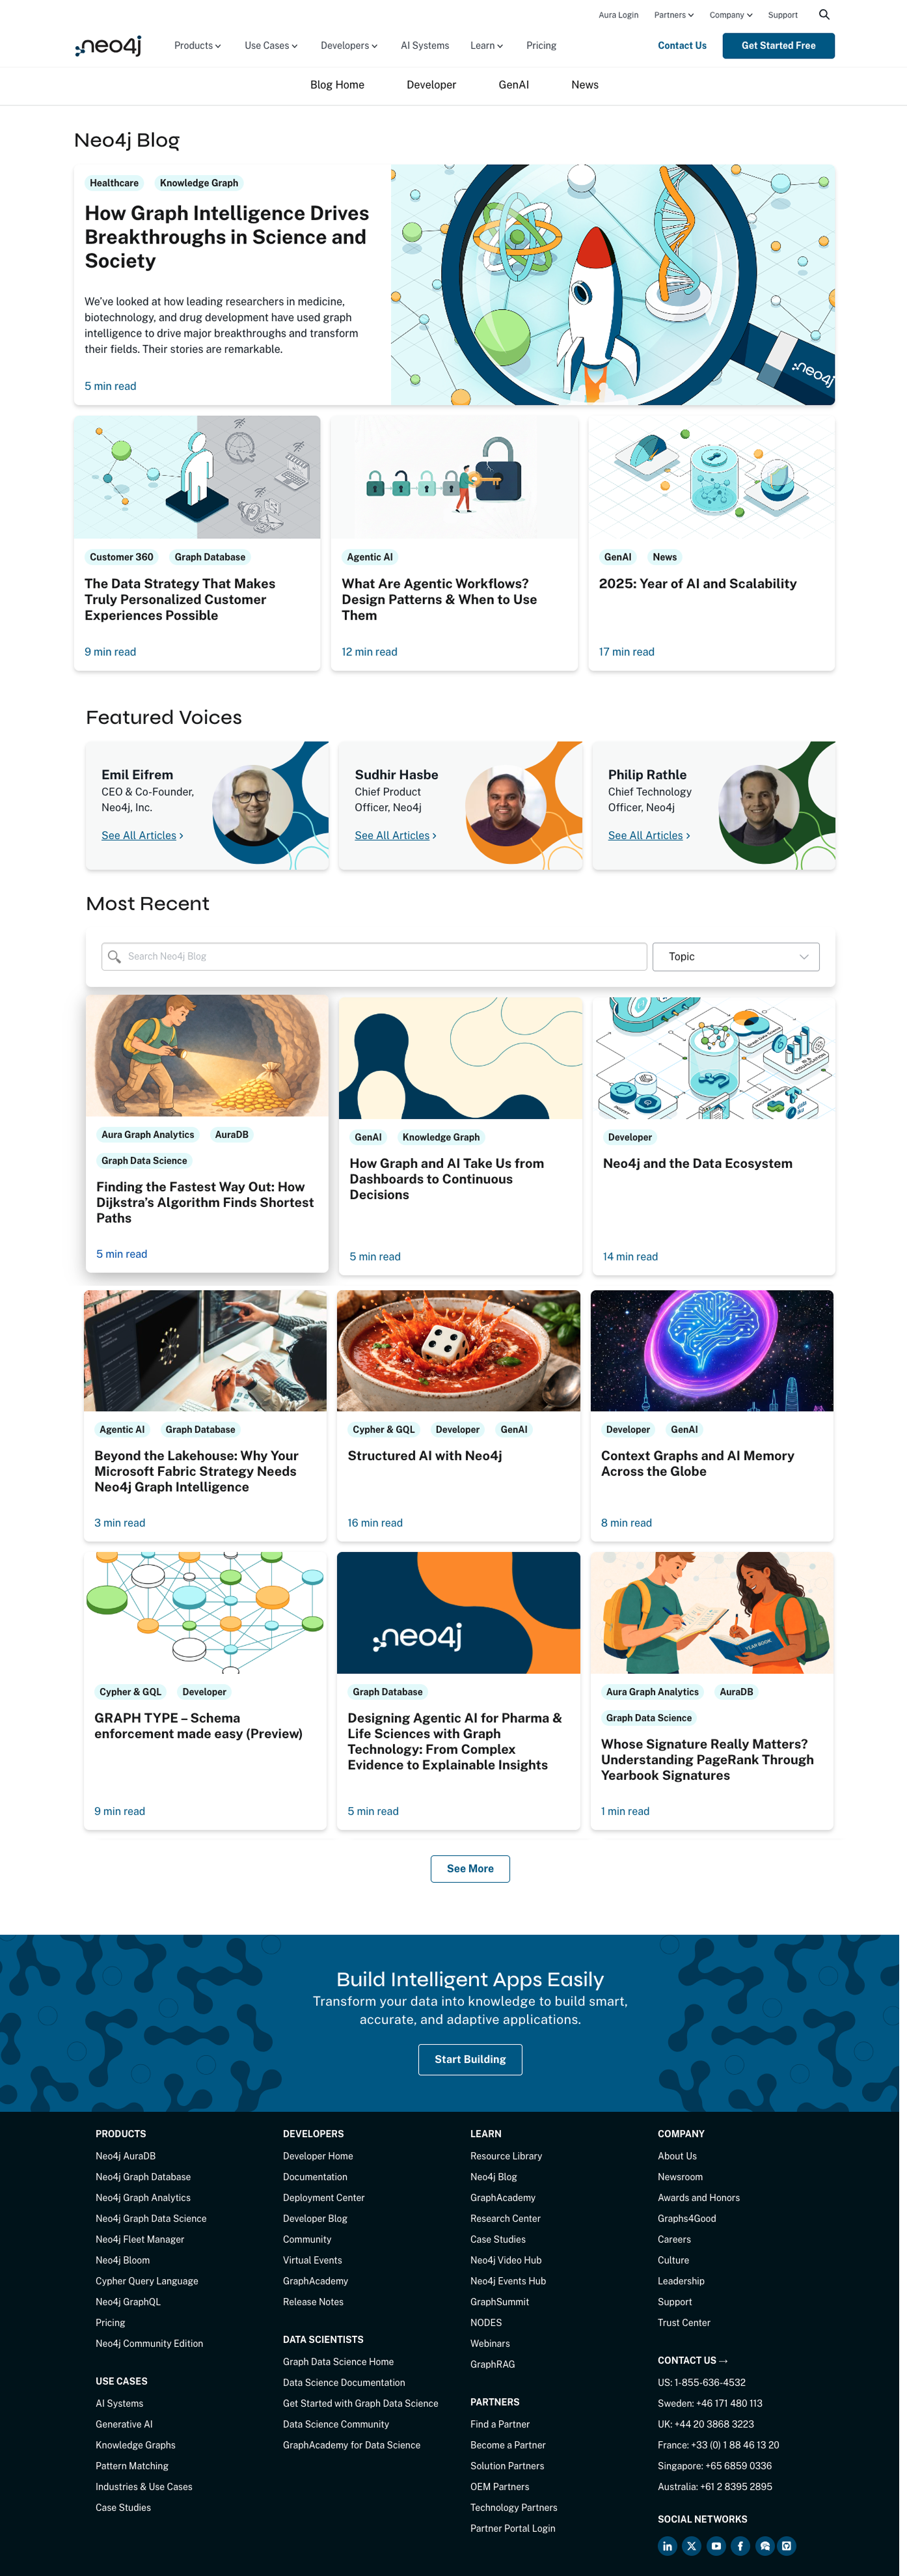
Over 16 months I redesigned the entire blog platform, video hub, events hub, and homepage. I led the Graph Summit conference portal covering nearly a dozen international events, multiple product launches, and the Developer Hub - a six-month engagement working directly with SVP of Dev Rel Steven Chin and a full engineering team. I was the entire web UX team.
The Result
A CRO audit conducted at the 12-month mark attributed the lift directly to elevated creative output from the web UX function. Over that period, pageviews increased 43%, sessions grew 16%, and engagement climbed 13%.
Neo4j operates on roughly $200M in annual recurring revenue. Web-based demand generation accounts for nearly a third of that. These weren't vanity metrics - they were moving the needle on a $60M+ revenue channel.
That function was me.
Developer Center: https://neo4j.com/developer/
Graph Summit: https://neo4j.com/graphsummit/
Blog Home: https://neo4j.com/blog/
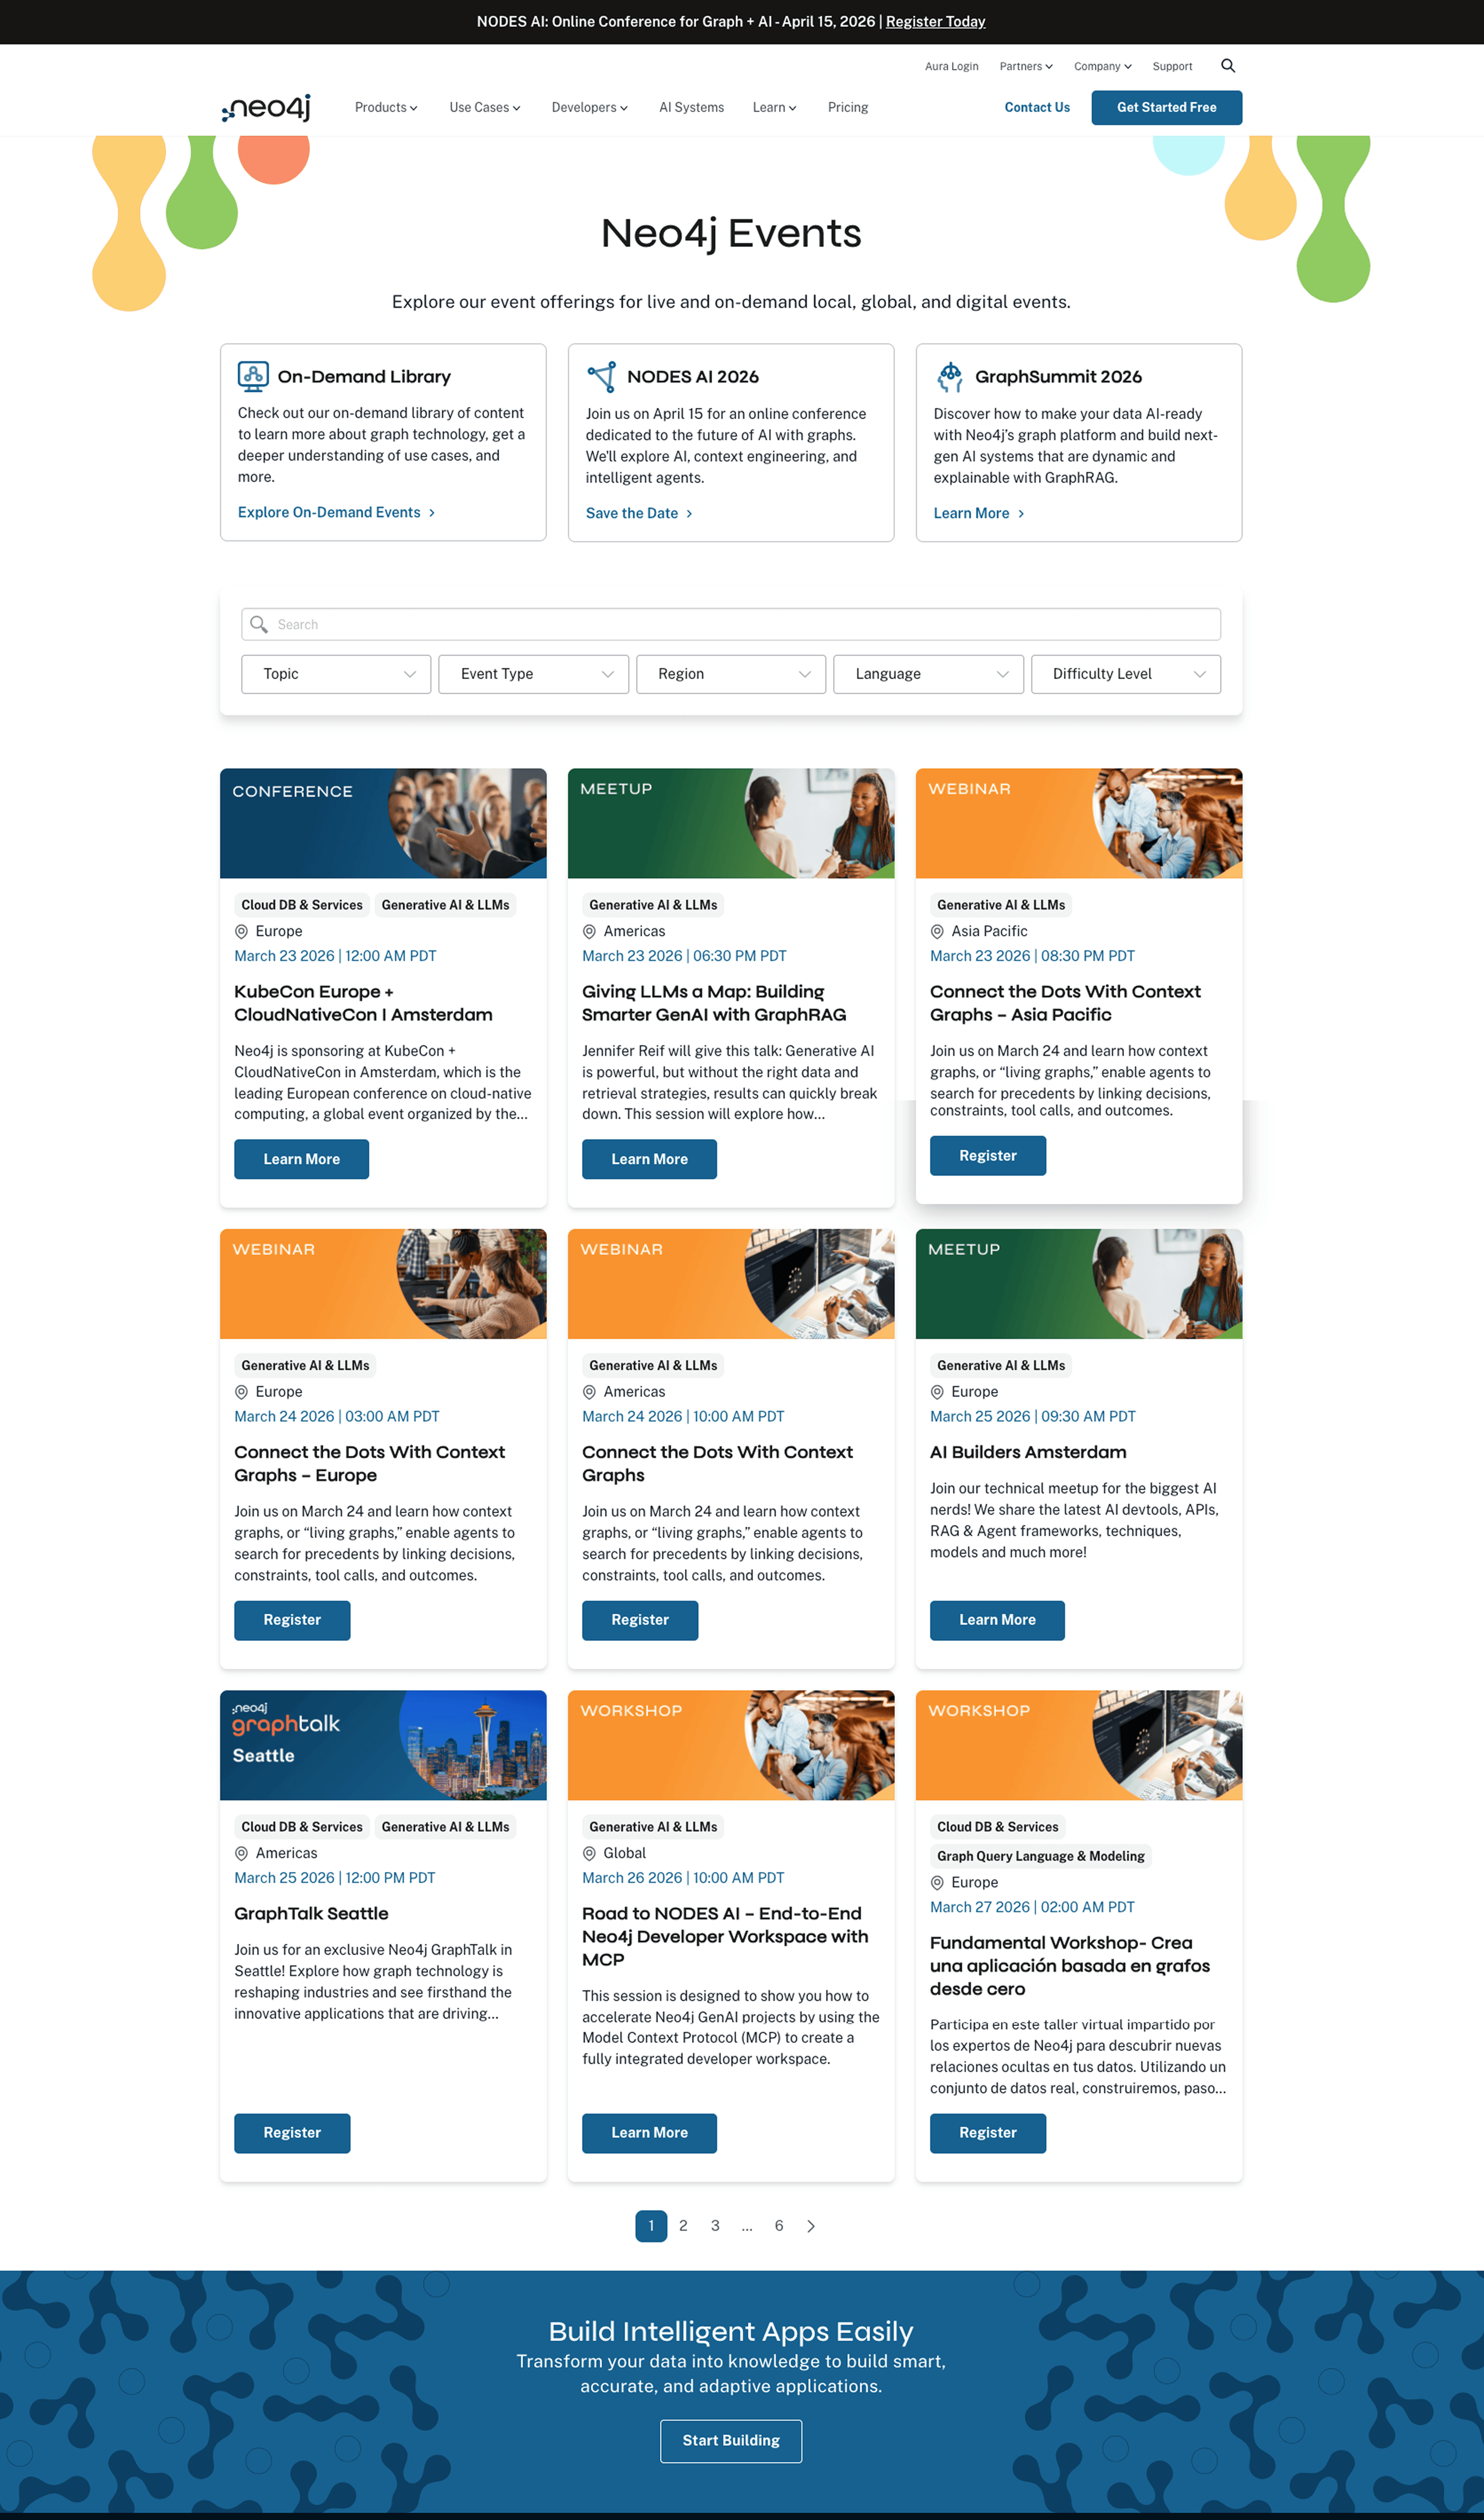
Events Hub: https://neo4j.com/events/
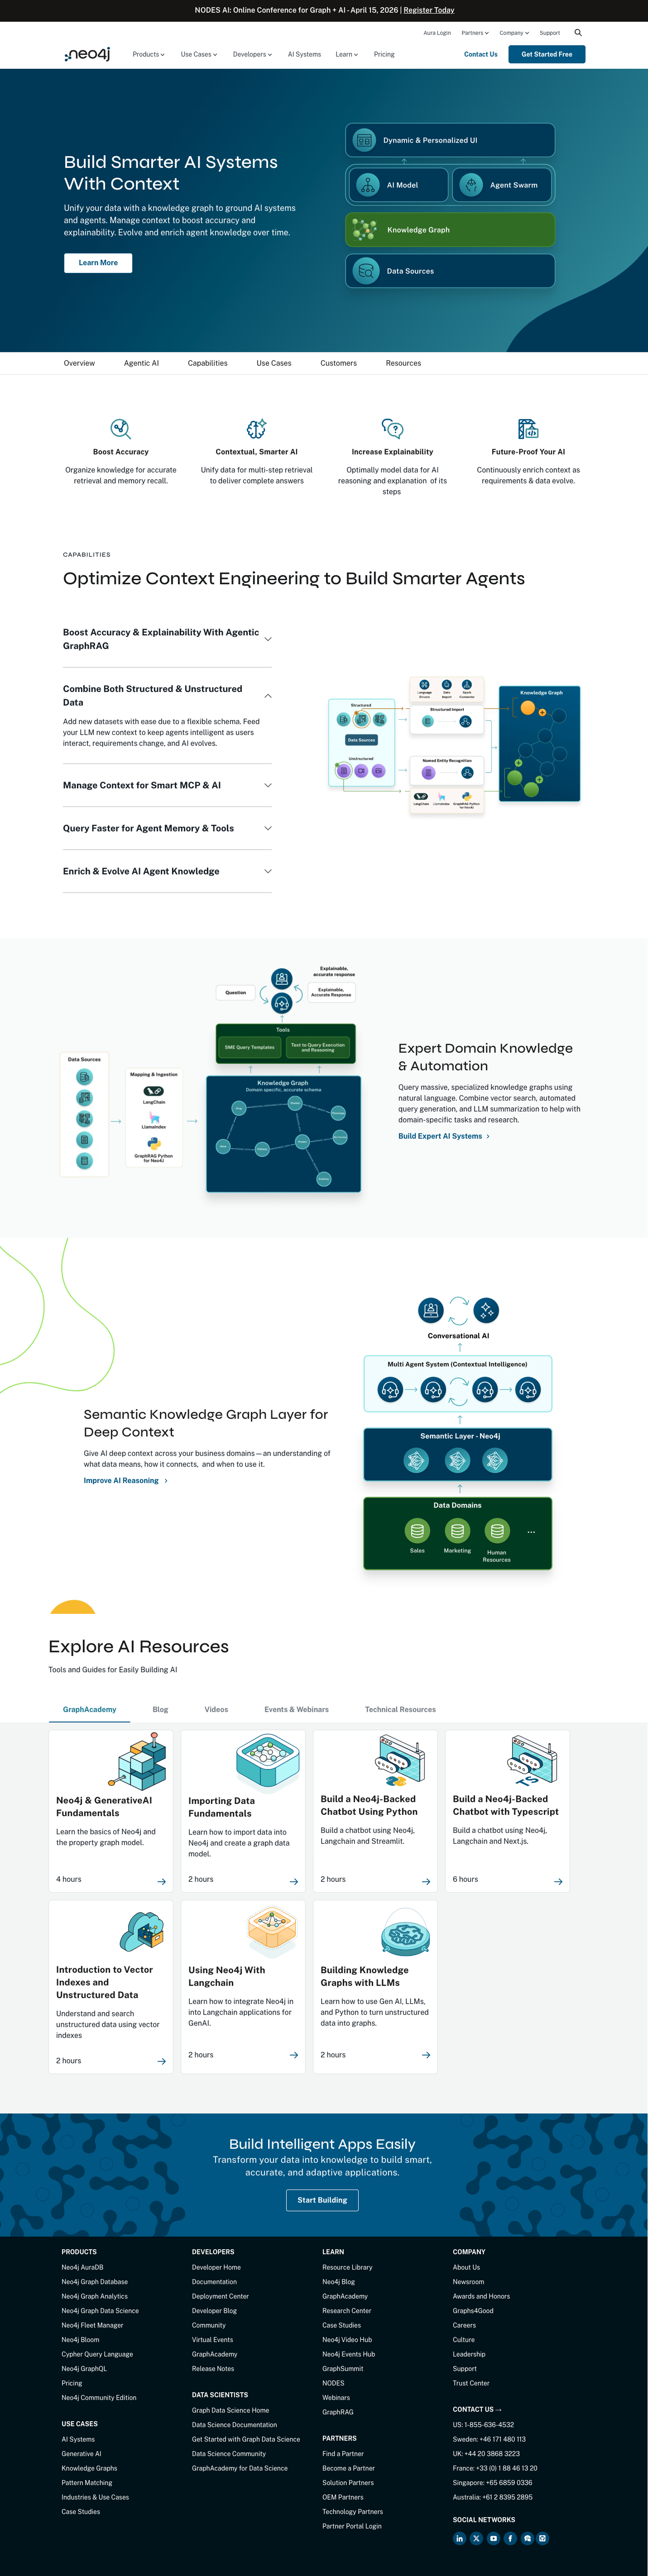
Use Case - AI Systems: https://neo4j.com/use-cases/ai-systems/
Product - Graph Analytics https://neo4j.com/product/aura-graph-analytics/